Site S1
Site S1 is located on Spicketts Creek at Bowraville Road Bridge, Brierfield.
Bellingen Riverwatch volunteers have tested this site for seven water quality parameters (Dissolved Oxygen, Water Temperature, Air Temperature, Electrical Conductivity, Available Phosphate, Turbidity, pH) from September 2017 ongoingly. Volunteers continue to monitor water quality at this site monthly.
Thank you to Andy Core who has gathered the water quality data for site S1, and to the roving volunteers that supported him.
Canopy Cover

S1 canopy cover 2022
Site Map
How to read our Water Quality Graphs
We interpret our water quality data by the method set out in this table to create bands of Very Good, Good, Fair, Poor and Very Poor.
Bellingen Riverwatch raw data is also available here.

S1 Water Quality Parameters
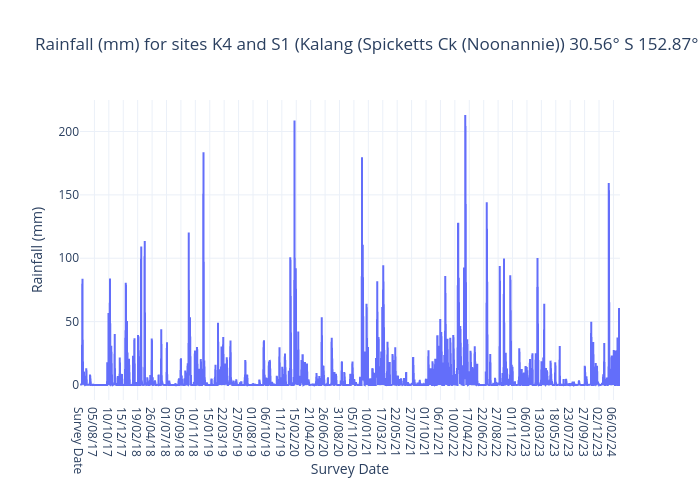
The graphs below show our full dataset for each parameter to date against the ‘Very Good’, ‘Good’, ‘Fair’, ‘Poor’ and ‘Very Poor’ bands (except water and site temperature). Click on the links to view an interactive graph where you can explore each datapoint. Also shown is the Bureau of Meterology Rainfall data for the nearest station to this site (Kalang (Spicketts Ck (Noonannie)) 30.56° S 152.87° E, code 059148).
Note - There is no estuarine guideline for EC as it can vary from fresh to sea water depending on the stream flow, tidal extent and depth of measurement. Bellingen Riverwatch (BR) volunteers still collect and BR partners analyse EC data for our estuarine sites behind the scenes as it is helpful to understand the tidal influence, especially at B7 and K4, which are at the upper limit of tidal influence. However, EC data for estuarine sites is not able to be interpreted for public data communication through the guidelines so it is omitted from our data reporting).
About the Water Quality Parameters
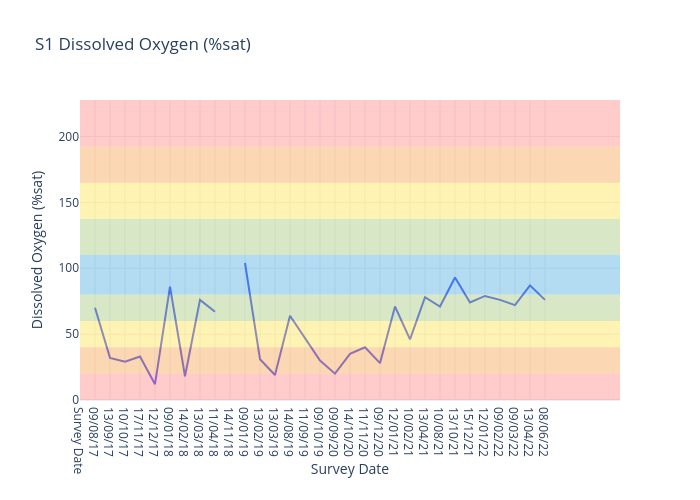
Dissolved Oxygen
-
Dissolved oxygen (DO) is a measure of how much oxygen is dissolved in the water - the amount of oxygen available to living aquatic organisms.
The amount of dissolved oxygen in a stream or lake can tell us a lot about its water quality. The amount of oxygen in the water regulates the distribution, activity, movement, and behaviour of all aquatic animals.
-
B1 is a freshwater site.
For freshwater sites, we use the following data interpretation for Dissolved Oxygen (% sat) :
Very Good : 85-110
Good : 63.75-<85 or >110-137.5
Fair : 42.5-<63.75 or 137.5-165
Poor : 21.25-<42.5 or >165-192.5
Very Poor : <21.25 or >192.5
These interpretation has been developed for Bellingen Riverwatch data by Adrian Dickson and Nakia Belmer, Science Division, Department of Planning and Environment.
-
The ANZECC Water Quality Values for Dissolved Oxygen for moderately disturbed ecosystems for Lowland Rivers (less than 150m elevation) is between 85% and 110% saturation.
Results outside the guidelines could be harmful to ecosystems. Dissolved Oxygen levels below 85% is a threat to aquatic life and the macroinvertebrates that our turtles love to eat. Potential impacts outside
ANZECC trigger values include lack of oxygen to support aquatic plant and animal life and fish kills. Monitoring Dissolved Oxygen levels is very important as the Bellingen River Snapping Turtle (BRST) is able to supplement its oxygen uptake through cloacal (bum) breathing, reducing its need to come to the water surface to breathe.
-
Oxygen enters the water :
as a waste product from the photosynthesis of aquatic plants and algae
via the transfer of oxygen across the water surface
through wave action, waterfalls and riffles.
Oxygen is lost from water when :
water temperature rises
salinity increases
plants and animals increase respiration
micro-organisms are feeding on decaying organic matter (eg. sewage, leaf litter)
Dissolved oxygen levels are affected by :
Sewage
Sediments erosion
Faeces from feedlots, dairies and pets
Phosphate based detergents
Decaying plant material
Fertilisers
Industrial Waste
Natural geological sources
Notes :
Dissolved Oxygen levels are highest in the afternoon as plants photosynthesise during the day
Very low oxygen levels can lead to fish kills.
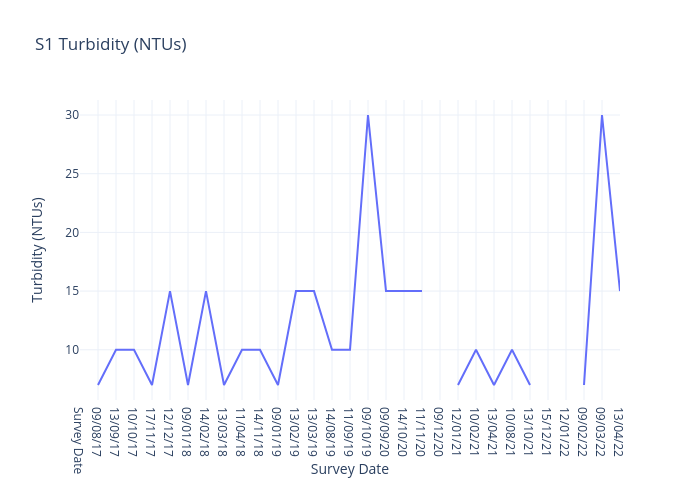
Turbidity
-
Turbidity is a measure of the cloudiness or muddiness of the water. The more silt and sediment is in the water, the higher the turbidity.
It is an optical characteristic of water and is a measurement of the amount of light that is scattered by material in the water when a light is shined through the water sample.
-
B1 is a freshwater site.
For freshwater sites, we use the following data interpretation for Turbidity (NTU) :
Very Good : ≤6
Good : >06≤7.5
Fair : >7.5≤9
Poor : >9≤10.5
Very Poor : >10.5
These interpretation has been developed for Bellingen Riverwatch data by Adrian Dickson and Nakia Belmer, Science Division, Department of Planning and Environment.
-
High turbidity can :
Suffocate aquatic organisms by clogging or damaging gills and mouth parts.
Reduce light penetration to aquatic plants, decreasing the rate of photosynthesis.
Aquatic plants can be smothered by settling sediments in areas where water flow slows.
-
River/stream bank erosion
Heavy rain or floods
Rural and urban runoff
Removal of vegetation
Stormwater
References:
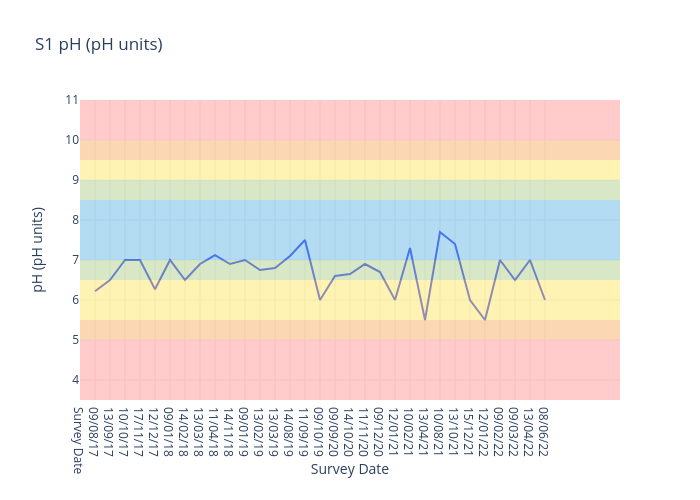
pH
-
pH is a measure of how acidic or alkaline a substance is where 7 represents neutrality, lower numbers indicate increasing acidity and higher numbers increasing alkalinity.
Each unit of change represents a tenfold change in acidity or alkalinity.
-
B1 is a freshwater site.
For freshwater sites, we use the following data interpretation for pH (pH units) :
Very Good : 6.5-8.5
Good : 6-<6.5 or >8.5-9
Fair : 5.5-<6 or >9-9.5
Poor : 4.5-<5.5 or >9.5-10
Very Poor : <4.5 or >10
These interpretation has been developed for Bellingen Riverwatch data by Adrian Dickson and Nakia Belmer, Science Division, Department of Planning and Environment.
-
The optimal pH for most organisms (plants & animals) in Australian freshwaters is 6.5 to 8.2. Changes in pH outside this normal range will cause a reduction in species diversity, as the more sensitive species disappear.
-
Geology
Urban runoff/stormwater
Acid sulphate soils
SewageDetergents & fertilisers
Industrial waste
Characteristics of the catchment
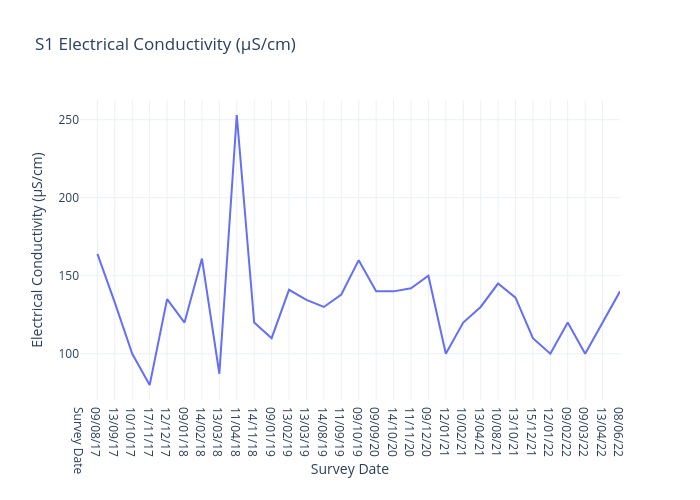
Electrical Conductivity
-
Electrical Conductivity is a measure of the physical ability of a sample to carry and electric current. Electrical conductivity is an indirect method of measuring salinity and includes the measurements of all salts and organic acids.
-
B1 is a freshwater site.
For freshwater sites, we use the following data interpretation for Electricaly Conductivity (µS/cm) :
Very Good : ≤200
Good : >200-≤250
Fair : >250-≤300
Poor : >300-≤350
Very Poor : >350
These interpretation has been developed for Bellingen Riverwatch data by Adrian Dickson and Nakia Belmer, Science Division, Department of Planning and Environment.
-
Many species can only survive in a very narrow range of salt concentration.
The removal of deep-rooted vegetation causes the water table to rise.
Tank water is ~ 130μS/cm. Sea water is ~55,000μS/cm.
Adverse impacts are likely in freshwater when salt concentrations reach 1500μS/cm.
-
Removal of vegetation
Poor irrigation practices
Mining /Industry
Sewage effluent discharge
Stormwater and agricultural runoff
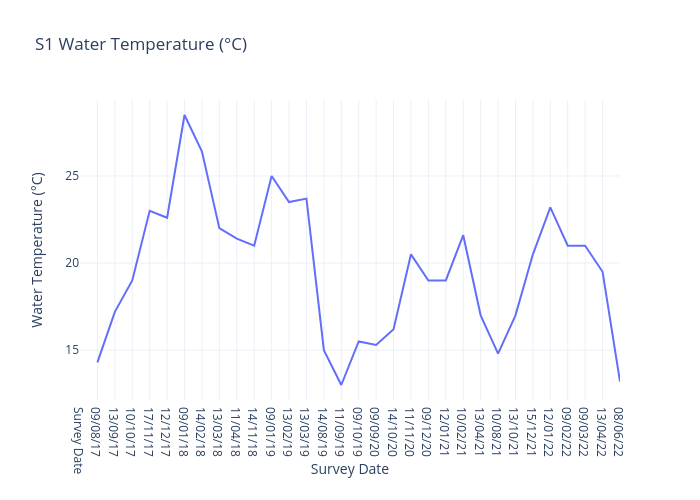
Water Temperature
-
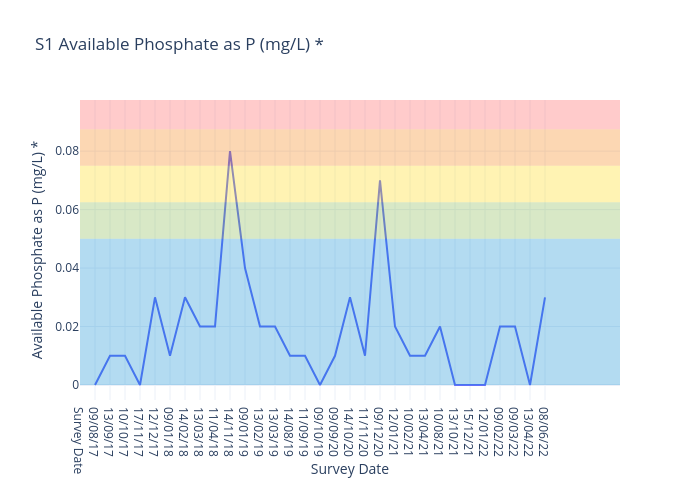
Phosphorus (P) is a naturally occurring nutrient that originates from plant and animal matter, and is applied as fertiliser to increase plant growth in agriculture. Phosphorus is essential to all forms of life on this planet. It is an essential nutrient necessary for growth and development of plants and animals on which our food supply depends.
Phosphorus occurs naturally in low concentrations in Australian soils and water. Native vegetation (both aquatic and terrestrial) have adapted to these low levels. In contrast, many introduced plants and weeks are adapted to higher phosphorus levels.
-
B1 is a freshwater site.
For freshwater sites, we use the following data interpretation for Available Phosphate (P^ (mg/L) :
Very Good : ≤0.02
Good : >0.02≤0.025
Fair : >0.025≤0.03
Poor : >0.03≤0.035
Very Poor : >0.035
These interpretation has been developed for Bellingen Riverwatch data by Adrian Dickson and Nakia Belmer, Science Division, Department of Planning and Environment.
Our data interpretation table
^Available Phosphate as P is calculated by dividing the Available Phosphate result by 3.06 to reach Phosphorus (P) result. -
The ANZECC Water Quality Trigger Value for Available Phosphates for moderately disturbed ecosystems for Lowland Rivers is 0.02mg/L.Frequent occurrence of above 0.02mg/L could be harmful to aquatic ecosystems and consequences are :
An abundance of algae and aquatic weeds (eg blue-green algal blooms) which out-compete native plants.
Waterways choked with vegetation resulting in reduced light penetration Increased biochemical oxygen demand.
Reduced dissolved oxygen which can lead to eutrophication and fish kills.
Reduced animal and plant diversity (exotic species are favoured, to the detriment of native species).
Eutrophication.
-
Sediment from erosion
Manure from feedlots, dairies and pet droppings
Sewage
Phosphate-based detergents
Decaying plant material
Fertiliser run-off
Industrial waste
Stagnant water
Organic waste
Plant material in the waterway (micro-organisms use the oxygen as they break down the organic matter).
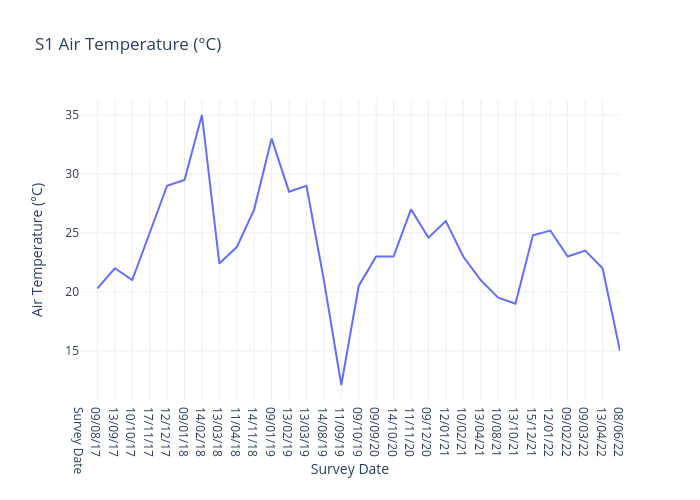
Air Temperature
-
Water temperature refers to the degree of warmth or coldness of a body of water, such as an ocean, river, lake, or even a swimming pool, at a specific location and time.
-
Monitoring and understanding water temperature is crucial for managing and preserving aquatic ecosystems, as well as for addressing climate change-related impacts on water bodies
Water temperature is essential for various purposes, including :
Aquatic Life
It affects the distribution, behavior, and health of aquatic species. Many aquatic organisms have specific temperature ranges they can tolerate or prefer.
Recreation
People often use water temperature as a factor in deciding whether to swim, surf, or engage in other water-related activities.
Water Management
Water temperature can impact water supply and quality. For example, it can influence the suitability of water for industrial processes, agriculture, and municipal water supply.
Scientific Research
Researchers study water temperature to understand its role in various environmental processes, such as the movement of ocean currents and the behavior of marine organisms.
-
Water temperature is a critical parameter in various fields, including environmental science, hydrology, meteorology, and marine biology, and it plays a significant role in determining the characteristics and behaviors of aquatic ecosystems.
Several factors can influence water temperature, including :
Solar Radiation
The amount of sunlight reaching the water's surface directly affects its temperature. Water absorbs and retains heat differently than land, so bodies of water can heat up or cool down more slowly than the surrounding air.
Seasonal Changes
Water temperatures can vary seasonally, with water generally being warmer in the summer and cooler in the winter. This variation is more pronounced in regions with distinct seasons.
Depth
Water temperatures can vary with depth, and this variation is more noticeable in larger bodies of water. Surface waters tend to respond more quickly to air temperature changes, while deeper waters may have a more stable temperature profile.
Flowing vs. Still Water
Rivers and streams can have different temperature patterns than lakes or ponds. Flowing water is often cooler and can have more consistent temperatures, while still water bodies can stratify into distinct layers with varying temperatures.
Geographic Location
The location of a body of water relative to the equator, proximity to the coast, and elevation can all influence its temperature. Coastal areas may have milder temperature variations due to the moderating effect of the ocean.
Human Activities
Human activities, such as industrial discharges and the removal of shade-providing vegetation, can influence water temperatures. Pollution and runoff can also affect water quality and temperature.
Available Phosphate
-
Air temperature, often referred to simply as "temperature," is a measure of the warmth or coldness of the air in a specific location at a given time.
-
Rivers can be significantly affected by very high temperatures, and the specific impacts can vary depending on the region, climate, and local conditions. Here are some of the common effects of high temperatures on rivers:
Reduced Water Levels
High temperatures can lead to increased evaporation rates from rivers and their tributaries. This can result in reduced water levels, which can be problematic for aquatic ecosystems, as it can restrict the habitat and resources available to fish and other aquatic organisms.
Warmer Water
As air temperatures rise, the temperature of river water also tends to increase. Warmer water can stress aquatic life, especially cold-water species like trout and salmon, which have narrow temperature tolerances. Prolonged exposure to high water temperatures can lead to fish kills and harm to other aquatic organisms.
Decreased Oxygen Levels
Warmer water holds less dissolved oxygen, which is essential for the survival of fish and other aquatic organisms. Reduced oxygen levels can lead to "hypoxia" or "anoxia," conditions in which oxygen levels are insufficient to support life, causing fish kills and harming other aquatic life.
Algal Blooms
High temperatures can promote the growth of algae in rivers and other bodies of water. While some algae are beneficial and form the base of aquatic food webs, excessive algal growth, or algal blooms, can deplete oxygen levels when the algae die and decompose. This can result in fish kills and degrade water quality.
Reduced Flow
Drought conditions often accompany high temperatures, leading to reduced river flow. This can have serious consequences for water availability, agriculture, and other industries that rely on river water for various purposes.
Increased Pollution Concentrations
High temperatures can exacerbate pollution problems in rivers. For example, warm water can enhance the growth of harmful bacteria and pathogens, making waterborne diseases more prevalent. Additionally, the concentration of certain pollutants may increase in warmer water, posing a greater risk to aquatic life and human health.
Changes in Habitat
High temperatures can alter the habitat structure of river ecosystems. For example, they can lead to the loss of riparian vegetation and the drying up of wetlands, which are important components of river ecosystems and provide habitat for various species.
It's important to note that the specific effects of high temperatures on rivers can vary widely based on regional climate patterns, river size, and local management practices. Mitigating the impacts of high temperatures on rivers often requires strategies such as water conservation, improved water management, and efforts to reduce the sources of pollution and nutrient runoff into rivers. Additionally, addressing the root causes of climate change through greenhouse gas emissions reduction is crucial for preventing more frequent and severe temperature-related impacts on rivers and other ecosystems.
-
Solar radiation
The amount of sunlight received by an area affects its temperature. During the day, when the sun is shining, temperatures tend to rise, and at night, they generally drop.
Latitude
Locations closer to the equator receive more direct sunlight and tend to have higher average temperatures than those near the poles.
Altitude
As you ascend in elevation, the air temperature tends to decrease. This is known as the lapse rate, and it's a key factor in understanding temperature variations in mountainous regions.
Proximity to large bodies of water
Water has a high heat capacity, meaning it can absorb and release heat more slowly than land. Areas near oceans or large lakes tend to have milder and more stable temperatures compared to inland areas.
Geographic features
Features like mountains, valleys, and urban areas can influence local temperature patterns due to their effects on air circulation and heat absorption.
We report on our data to help influence policy and decision making, and educate the community, now and into the future.
Note - Our raw data is shared with with the NSW Government Saving our Species recovery program for the BRST and is additionally available at both the Waterwatch portal and the DPIE SEED portal.
Raw Data
Our raw data can be found at the links below :